class="markdown_views prism-kimbie-light">

2.回归方法 先聚类,再回归 3.累积、区域生长算法 感觉对噪声数据真的没办法了,窝成一团的点,提取的线十分破碎而且乱…
slam国内外数据库
(牛逼博主连接:https://www.cnblogs.com/yhlx125/p/5609998.html) http://www.ifp.uni-stuttgart.de/ISPRS-EuroSDR/ImageMatching/index.html http://www.robots.ox.ac.uk/NewCollegeData/index.php?n=Main.Downloads#GettingStarted http://asrl.utias.utoronto.ca/datasets/devon-island-rover-navigation/ http://kos.informatik.uni-osnabrueck.de/3Dscans/2D激光扫描匹配方法
1.Beam Model
Beam Model我将它叫做测量光束模型。个人理解,它是一种完全的物理模型,只针对激光发出的测量光束建模。将一次测量误差分解为四个误差。 phhitphhit,测量本身产生的误差,符合高斯分布。 phxxphxx,由于存在运动物体产生的误差。 …2.Likehood field
似然场模型,和测量光束模型相比,考虑了地图的因素。不再是对激光的扫描线物理建模,而是考虑测量到的物体的因素。 似然比模型本身是一个传感器观测模型,之所以可以实现扫描匹配,是通过划分栅格,步进的方式求的最大的Score,将此作为最佳的位姿。for k=1:size(zt,1)
if zt(k,2)>0
d = -grid_dim/2;
else
d = grid_dim/2;
end
phi = pi_to_pi(zt(k,2) + x(3));
if zt(k,1) ~= Z_max
ppx = [x(1),x(1) + zt(k,1)*cos(phi) + d];
ppy = [x(2),x(2) + zt(k,1)*sin(phi) + d];
end_points = [end_points;ppx(2),ppy(2)];
wm = likelihood_field_range_finder_model(X(j,:)',xsensor,...
zt(k,:)',nearest_wall, grid_dim, std_hit,Z_weights,Z_max);
W(j) = W(j) * wm;
else
dist = Z_max + std_hit*randn(1);
ppx = [x(1),x(1) + dist*cos(phi) + d];
ppy = [x(2),x(2) + dist*sin(phi) + d];
missed_points = [missed_points;ppx(2),ppy(2)];
end
set(handle_sensor_ray(k),'XData', ppx, 'YData', ppy)
end
function q = likelihood_field_range_finder_model(X,x_sensor,zt,N,dim,std_hit,Zw,z_max)
% retorna probabilidad de medida range finder :)
% X col, zt col, xsen col
[n,m] = size(N);

% Robot global position and orientation
theta = X(3);

% Beam global angle
theta_sen = zt(2);
phi = pi_to_pi(theta + theta_sen);

%Tranf matrix in case sensor has relative position respecto to robot's CG
rotS = [cos(theta),-sin(theta);sin(theta),cos(theta)];

% Prob. distros parameters
sigmaR = std_hit;
zhit  = Zw(1);
zrand = Zw(2);
zmax  = Zw(3);

% Actual algo
q = 1;
if zt(1) ~= z_max
    % get global pos of end point of measument
    xz = X(1:2) + rotS*x_sensor + zt(1)*[cos(phi);
                                         sin(phi)];
    xi = floor(xz(1)/dim) + 1;
    yi = floor(xz(2)/dim) + 1;

    % if end point doesn't lay inside map: unknown
    if xi<1 || xi>n || yi<1 || yi>m
        q = 1.0/z_max; % all measurements equally likely, uniform in range [0-zmax]
        return
    end

    dist2 = N(xi,yi);
    gd = gauss_1D(0,sigmaR,dist2);
    q = zhit*gd + zrand/zmax;
end

end
3.Correlation based sensor models相关分析模型
XX提出了一种用相关函数表达马尔科夫过程的扫描匹配方法。 互相关方法Cross-Correlation,另外相关分析在进行匹配时也可以应用,比如对角度直方图进行互相关分析,计算变换矩阵。 参考文献:A Map Based On Laser scans without geometric interpretation circular Cross-Correlation的Matlab实现% Computes the circular cross-correlation between two sequences
%
% a,b the two sequences
% normalize if true, normalize in [0,1]
%
function c = circularCrossCorrelation(a,b,normalize)
for k=1:length(a)
c(k)=a*b';
b=[b(end),b(1:end-1)]; % circular shift
end
if normalize
minimum = min(c);
maximum = max(c);
c = (c - minimum) / (maximum-minimum);
end
4.MCL
蒙特卡洛方法
5.AngleHistogram
角度直方图
6.ICP/PLICP/MBICP/IDL
属于ICP系列,经典ICP方法,点到线距离ICP,
7.NDT
正态分布变换
8.pIC
结合概率的方法
9.线特征
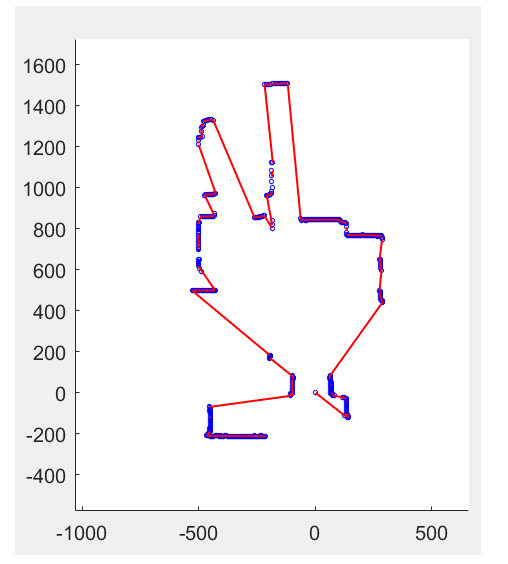
目前应用线段进行匹配的试验始终不理想:因为线对应容易产生错误,而且累积误差似乎也很明显!
2D激光线特征提取
Nguyen, V., et al. (2007).“A comparison of line extraction algorithms using 2D range data for indoor mobile robotics.” Autonomous Robots 23(2): 97-111. 论文提出了6中从二维激光扫描数据中提取线段的方法 1.分割合并算法
2.回归方法 先聚类,再回归 3.累积、区域生长算法 感觉对噪声数据真的没办法了,窝成一团的点,提取的线十分破碎而且乱…
function [ lineSegCoord ] = extractLineSegment( model,normals,intervalPts,normalDelta,dThreshold)
%EXTRACTLINESEGMENT Summary of this function goes here
%   Detailed explanation goes here
if (nargin == 0) || isempty(model)
    lineSegCoord = [];
    return;
end;
ns = createns(model','NSMethod','kdtree')
pts=size(model,2);
if (nargin == 3)
    normalDelta=0.9;
    dThreshold=0.5;
end
if isempty(normals)
    normals=zeros(2,pts);
    for nor=1:pts
        [idx, dist] = knnsearch(ns,model(:,nor)','k',2);
        data=model(:,idx);
        men=mean(data,2);
        rep= repmat(men,1,size(data,2));
        data = data - rep;
        % Compute the MxM covariance matrix A
        A = cov(data');
        % Compute the eigenvector of A
        [V, LAMBDA] = eig(A);
        % Find the eigenvector corresponding to the minimum eigenvalue in A
        % This should always be the first column, but check just in case
        [~,idx] = min(diag(LAMBDA));
        % Normalize
        V = V(:,idx)./norm(V(:,idx));
        %定向
        normals(:,nor)=V;
    end
end

    lineSeg=[1;1];
    newLineIdx=1;
    for j=2:pts-1
        current=model(:,j);
        pre=model(:,j-1);
        next=model(:,j+1);
        curNormal=normals(:,j);
        preNormal=normals(:,j-1);
        nextNormal=normals(:,j+1);
        [d,vPt]=Dist2D_Point_to_Line(current,pre,next);
        dis=norm(current-pre);
        delta=dot(curNormal,preNormal)/(norm(curNormal)*norm(preNormal));
        if(delta>normalDelta&& d intervalPts)
            try
                pts= model(:,(from:to));
                coef1 = polyfit(pts(1,:),pts(2,:),1);
                k2 = coef1(1);
                b2 = coef1(2);
                coef2 = robustfit(pts(1,:),pts(2,:),'welsch');
                k2 = coef2(2);
                b2 = coef2(1);
                ML = true;
            catch
                ML = false;
            end;
            [D,fPb]= Dist2D_Point_to_Line(model(:,from),[0 b2]',[1 k2+b2]');
            [D,tPb]= Dist2D_Point_to_Line(model(:,to),[0 b2]',[1 k2+b2]');
            interval=abs(model(1,from) -model(1,to));
            if(interval>0.05)
                x = linspace(fPb(1) ,tPb(1), 5);
                if ML
                    y_ML = k2*x +b2;
                    lineSegCoord=[lineSegCoord [fPb(1) fPb(2) tPb(1) tPb(2)]'];
                    plot(x, y_ML, 'b-', 'LineWidth', 1);
                end;
            else
                y = linspace(fPb(2) ,tPb(2), 5);
                if ML
                    x_ML =(y-b2)/k2;
                    lineSegCoord=[lineSegCoord [fPb(1) fPb(2) tPb(1) tPb(2)]'];
                    plot(x_ML, y, 'b-', 'LineWidth', 1);
                end;
            end;
%             try
%                 tmpPts= model(:,(from:to));
%                 Theta_ML = estimate_line_ML(tmpPts,[], sigma, 0);
%                 ML = true;
%             catch
%                 % probably the optimization toolbox is not installed
%                 ML = false;
%             end;
%             interval=abs(model(1,from) -model(1,to));
%             if(interval>10)
%                 x = linspace(model(1,from) ,model(1,to), 5);
%                 if ML
%                     y_ML = -Theta_ML(1)/Theta_ML(2)*x - Theta_ML(3)/Theta_ML(2);
%                     lineSegCoord=[lineSegCoord [x(1) y_ML(1) x(5) y_ML(5)]'];
%                     plot(x, y_ML, 'b-', 'LineWidth', 1);
%                 end;
%             else
%                 y = linspace(model(2,from) ,model(2,to), 5);
%                 if ML
%                     x_ML = -Theta_ML(2)/Theta_ML(1)*y - Theta_ML(3)/Theta_ML(1);
%                     lineSegCoord=[lineSegCoord [x_ML(1) y(1) x_ML(5) y(5)]'];
%                     plot(x_ML, y, 'b-', 'LineWidth', 1);
%                 end;
%             end;
        end
    end
end
4.Ransac方法
5.霍夫变换方法
6.EM方法