{var%20f='http://v.t.sina.com.cn/share/share.php?appkey=1515056452',u=z||d.location,p=['&url=',e(u),'&title=',e(t||d.title),'&source=',e(r),'&sourceUrl=',e(l),'&content=',c||'gb2312','&pic=',e(p||'')].join('');function%20a(){if(!window.open([f,p].join(''),'mb',['toolbar=0,status=0,resizable=1,width=440,height=430,left=',(s.width-440)/2,',top=',(s.height-430)/2].join('')))u.href=[f,p].join('');};if(/Firefox/.test(navigator.userAgent))setTimeout(a,0);else%20a();})(screen,document,encodeURIComponent,'','','https://www.xiaopingtou.cn//data/attach/topic/topicKPo7gB.jpg', '推荐 kamfun 的文章《QCustomPlot安装使用教程》','https://www.xiaopingtou.net/article-74876.html','页面编码gb2312|utf-8默认gb2312'));)
1.概述
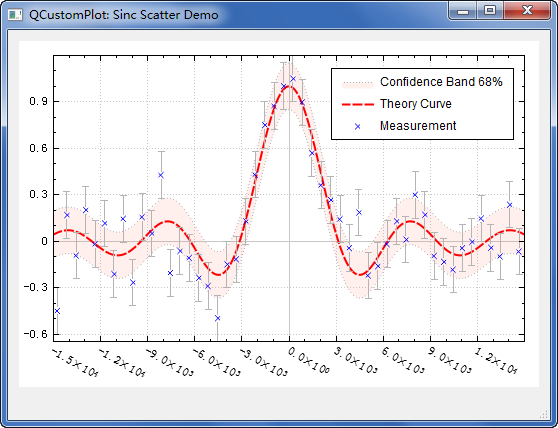
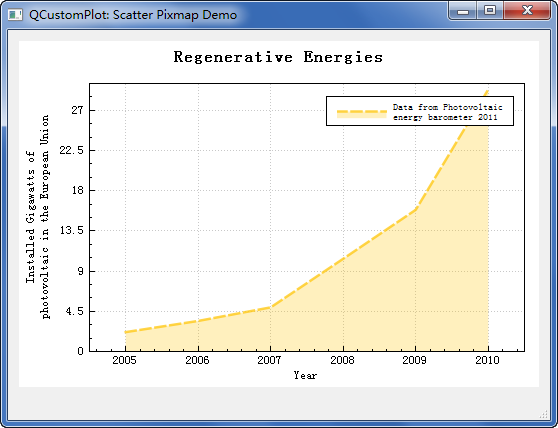
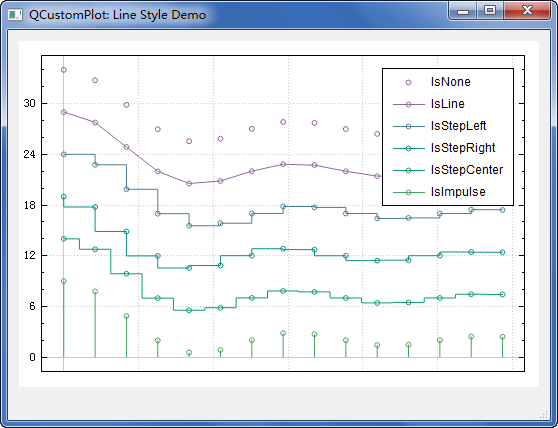
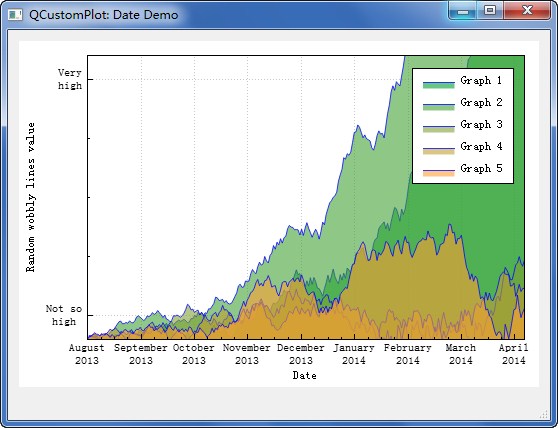
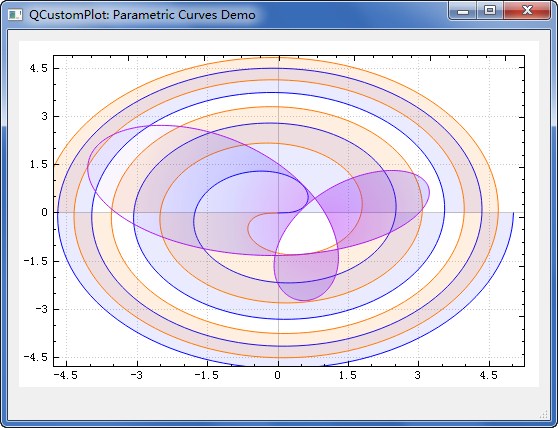
QCustomPlot 是一个超强超小巧的qt绘图类,非常漂亮,非常易用,只需要加入一个qcustomplot.h和qcustomplot.cpp文件即可使用,远比qwt方便和漂亮,可以自己使用两个源文件也可以自己编译成库文件,非常方便。 官方网站:http://www.qcustomplot.com/ 1.0下载地址:http://download.csdn.net/detail/czyt1988/5986701 下面展示一下它的超强功能:


1.安装
使用QCustomPlot非常简单,只需要把qcustomplot.cpp和qcustomplot.h拷贝到工程目录下,然后把这两个文件引入工程项目即可 在项目中点右键添加现有文件,把两个文件加入工程
这时pro文件会添加上qcustomplot.cpp和qcustomplot.h,这时还需要添加的是

这时就可以使用QCustomPlot了。 为了能在ui designer里面使用QCustomPlot,可以使用一个Widget窗体在ui设计器上,对这个窗体点击右键,选择提升为
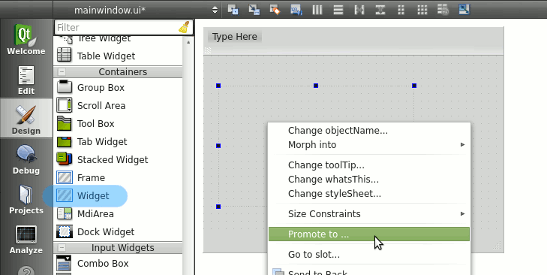
把提升的类名填写为QCustomPlot即可,这样就可以使用了,使用就和我们用普通控件一样,ui->xxx->……

2.绘图
QCustomPlot的绘图过程非常非常简单。和大部分的绘图控件相似,绘图时首先需要有一个图形,或者说是图层,通过addGraph即可添加一个曲线图层,此函数返回这个曲线图层的指针,或者通过曲线索引来找到,所有添加的曲线都放置在一个list里面,如果是第一个添加的话,那么这个索引就是0了,void setData (const QVector<double > &key, const QVector<double > &value) 只要有个x,y等长度的vector数据即可轻松绘图 也可以追加数据
void addData (const QCPData&data)
void addData (double key,double value)
void addData (const QVector<double > &keys, const QVector<double > &values) QCustomPlot这个类设计的非常清晰明了,离散化程度不高,非常易用 设置完数据后可以对x,y轴进行设置
customPlot->yAxis->setLabel("y"); 或者设置x,y轴的范围
customPlot->yAxis->setRange(0,1); 如果你不清楚范围,而已使用 QCustomPlot::rescaleAxes()函数,它会自动设置最合适的显示范围,非常简便。 设置完成后即可显示图像 使用QCustomPlot::replot函数使图像进行重绘,show函数也会触发重绘事件。 效果:

这时绘制出来的图像是不能移动或者是放大缩小的,QCustomPlot可以很简单实现移动和放大缩小功能 使用QCustomPlot的函数setInteractions即可 setInteractions(QCP::iRangeDrag | QCP::iRangeZoom); 这样就能实现移动和缩放了